Returns analytics
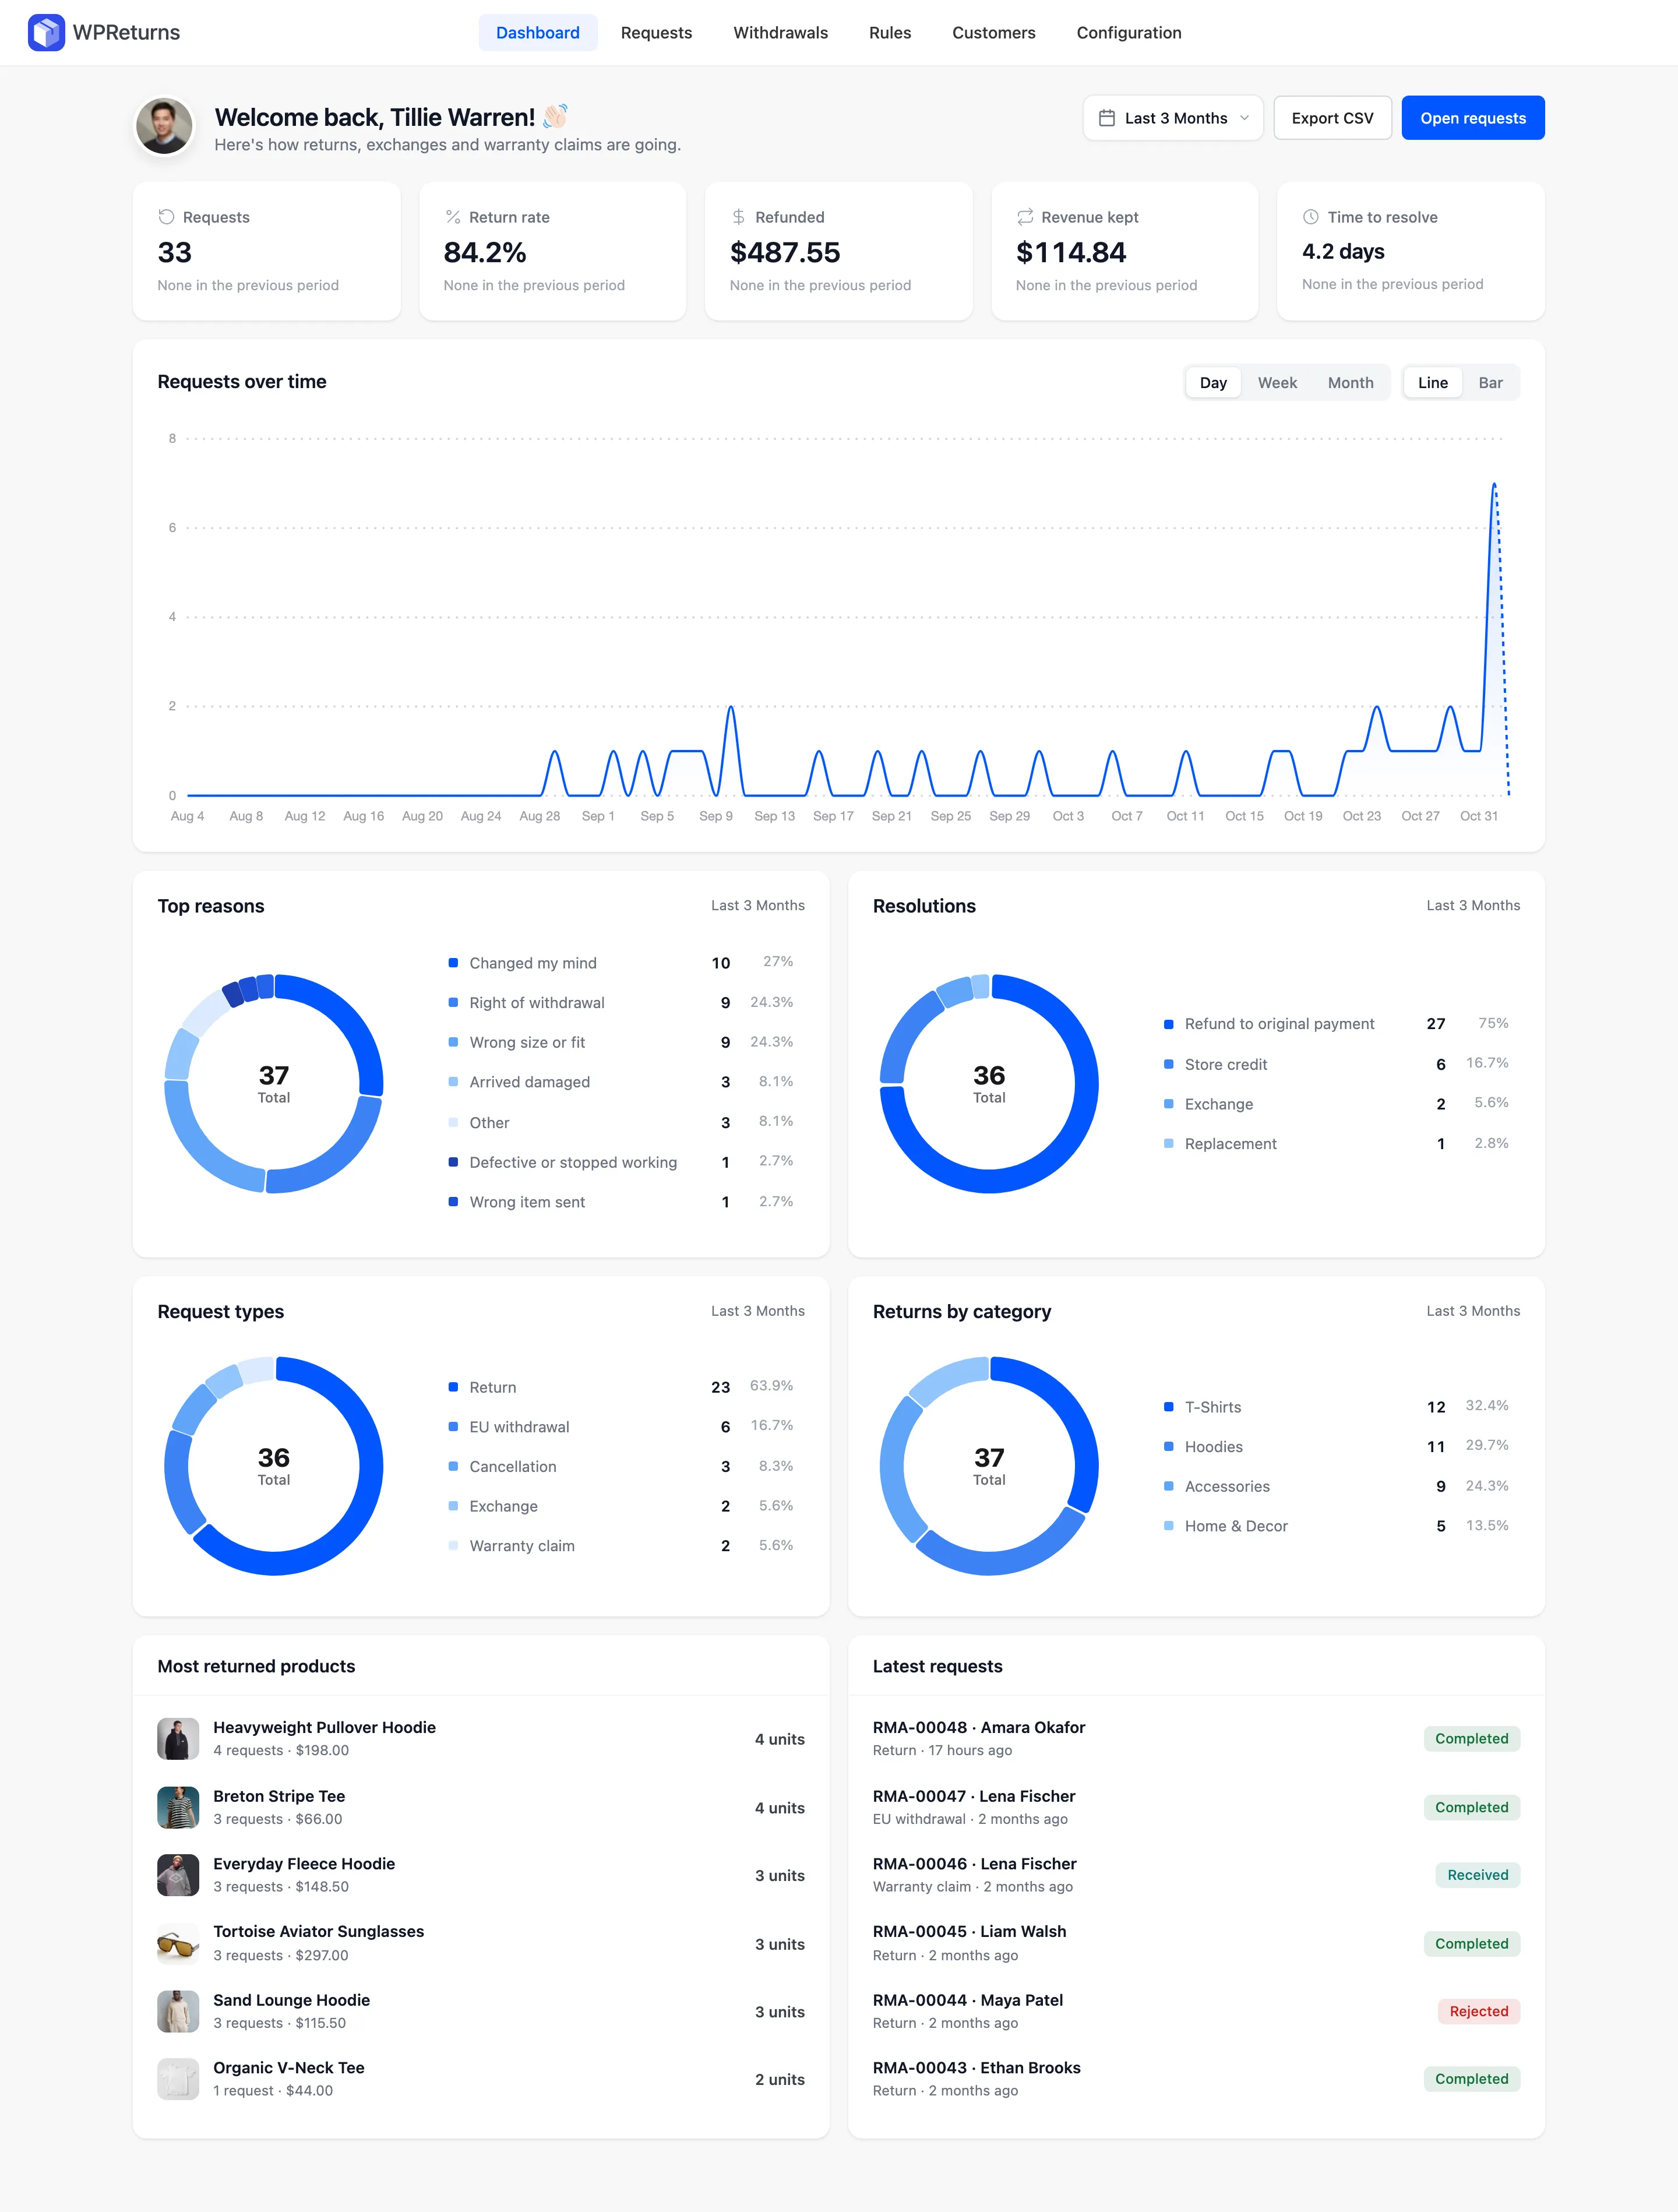
The returns analytics dashboard shows how returns affect your store for any date range. Cards show the return rate, money refunded, revenue kept and the average time to resolve against the period before. Charts break requests down by reason, resolution, type and category.
Available in: Free and Pro. The free dashboard shows request counts, refunds, withdrawals, time to resolve, the requests chart and the latest requests. Return rate, revenue kept, reasons, resolutions, categories, top products and the CSV export need Pro.
Open it at DevDiggers Plugins > WPReturns > Dashboard. It needs the ddwcwr_view_reports capability in Pro.
Summary cards
Section titled “Summary cards”| Card | What it measures |
|---|---|
| Requests | Requests created in the range |
| Return rate | Orders with a request divided by paid orders in the range. The note shows “Of 312 paid orders”. |
| Refunded | Money refunded through refund and keep-it resolutions |
| Revenue kept | Store credit issued plus the value of completed exchanges |
| Time to resolve | Average time from request to Completed. Short times read “Under an hour”. |
Cancellation requests are left out of these numbers. They are not returns.
Under each value, the card shows the previous period’s figure and the change in percent. The previous period has the same length and ends the day before your range starts. With no data there, the card reads “None in the previous period”.
Green means the number moved in the good direction. Fewer requests, a lower return rate and less refunded money count as good. More revenue kept counts as good too.
Charts and lists
Section titled “Charts and lists”| Panel | What it shows |
|---|---|
| Requests over time | The number of requests across the range. Day, Week and Month set the grouping, and Line or Bar the chart style. |
| Top reasons | The reasons customers pick most |
| Resolutions | How requests were resolved: refund, store credit, exchange and others |
| Request types | Returns, exchanges, warranty claims, withdrawals and cancellations |
| Returns by category | Returned items grouped by product category |
| Most returned products | Products with the most returned units, such as “3 units”, with their request count and value |
| Latest requests | The newest requests with RMA number, customer, type, time and status, each linked to the request |
Empty panels say what will appear once data exists. An example is “No reasons yet”.
Pick a date range
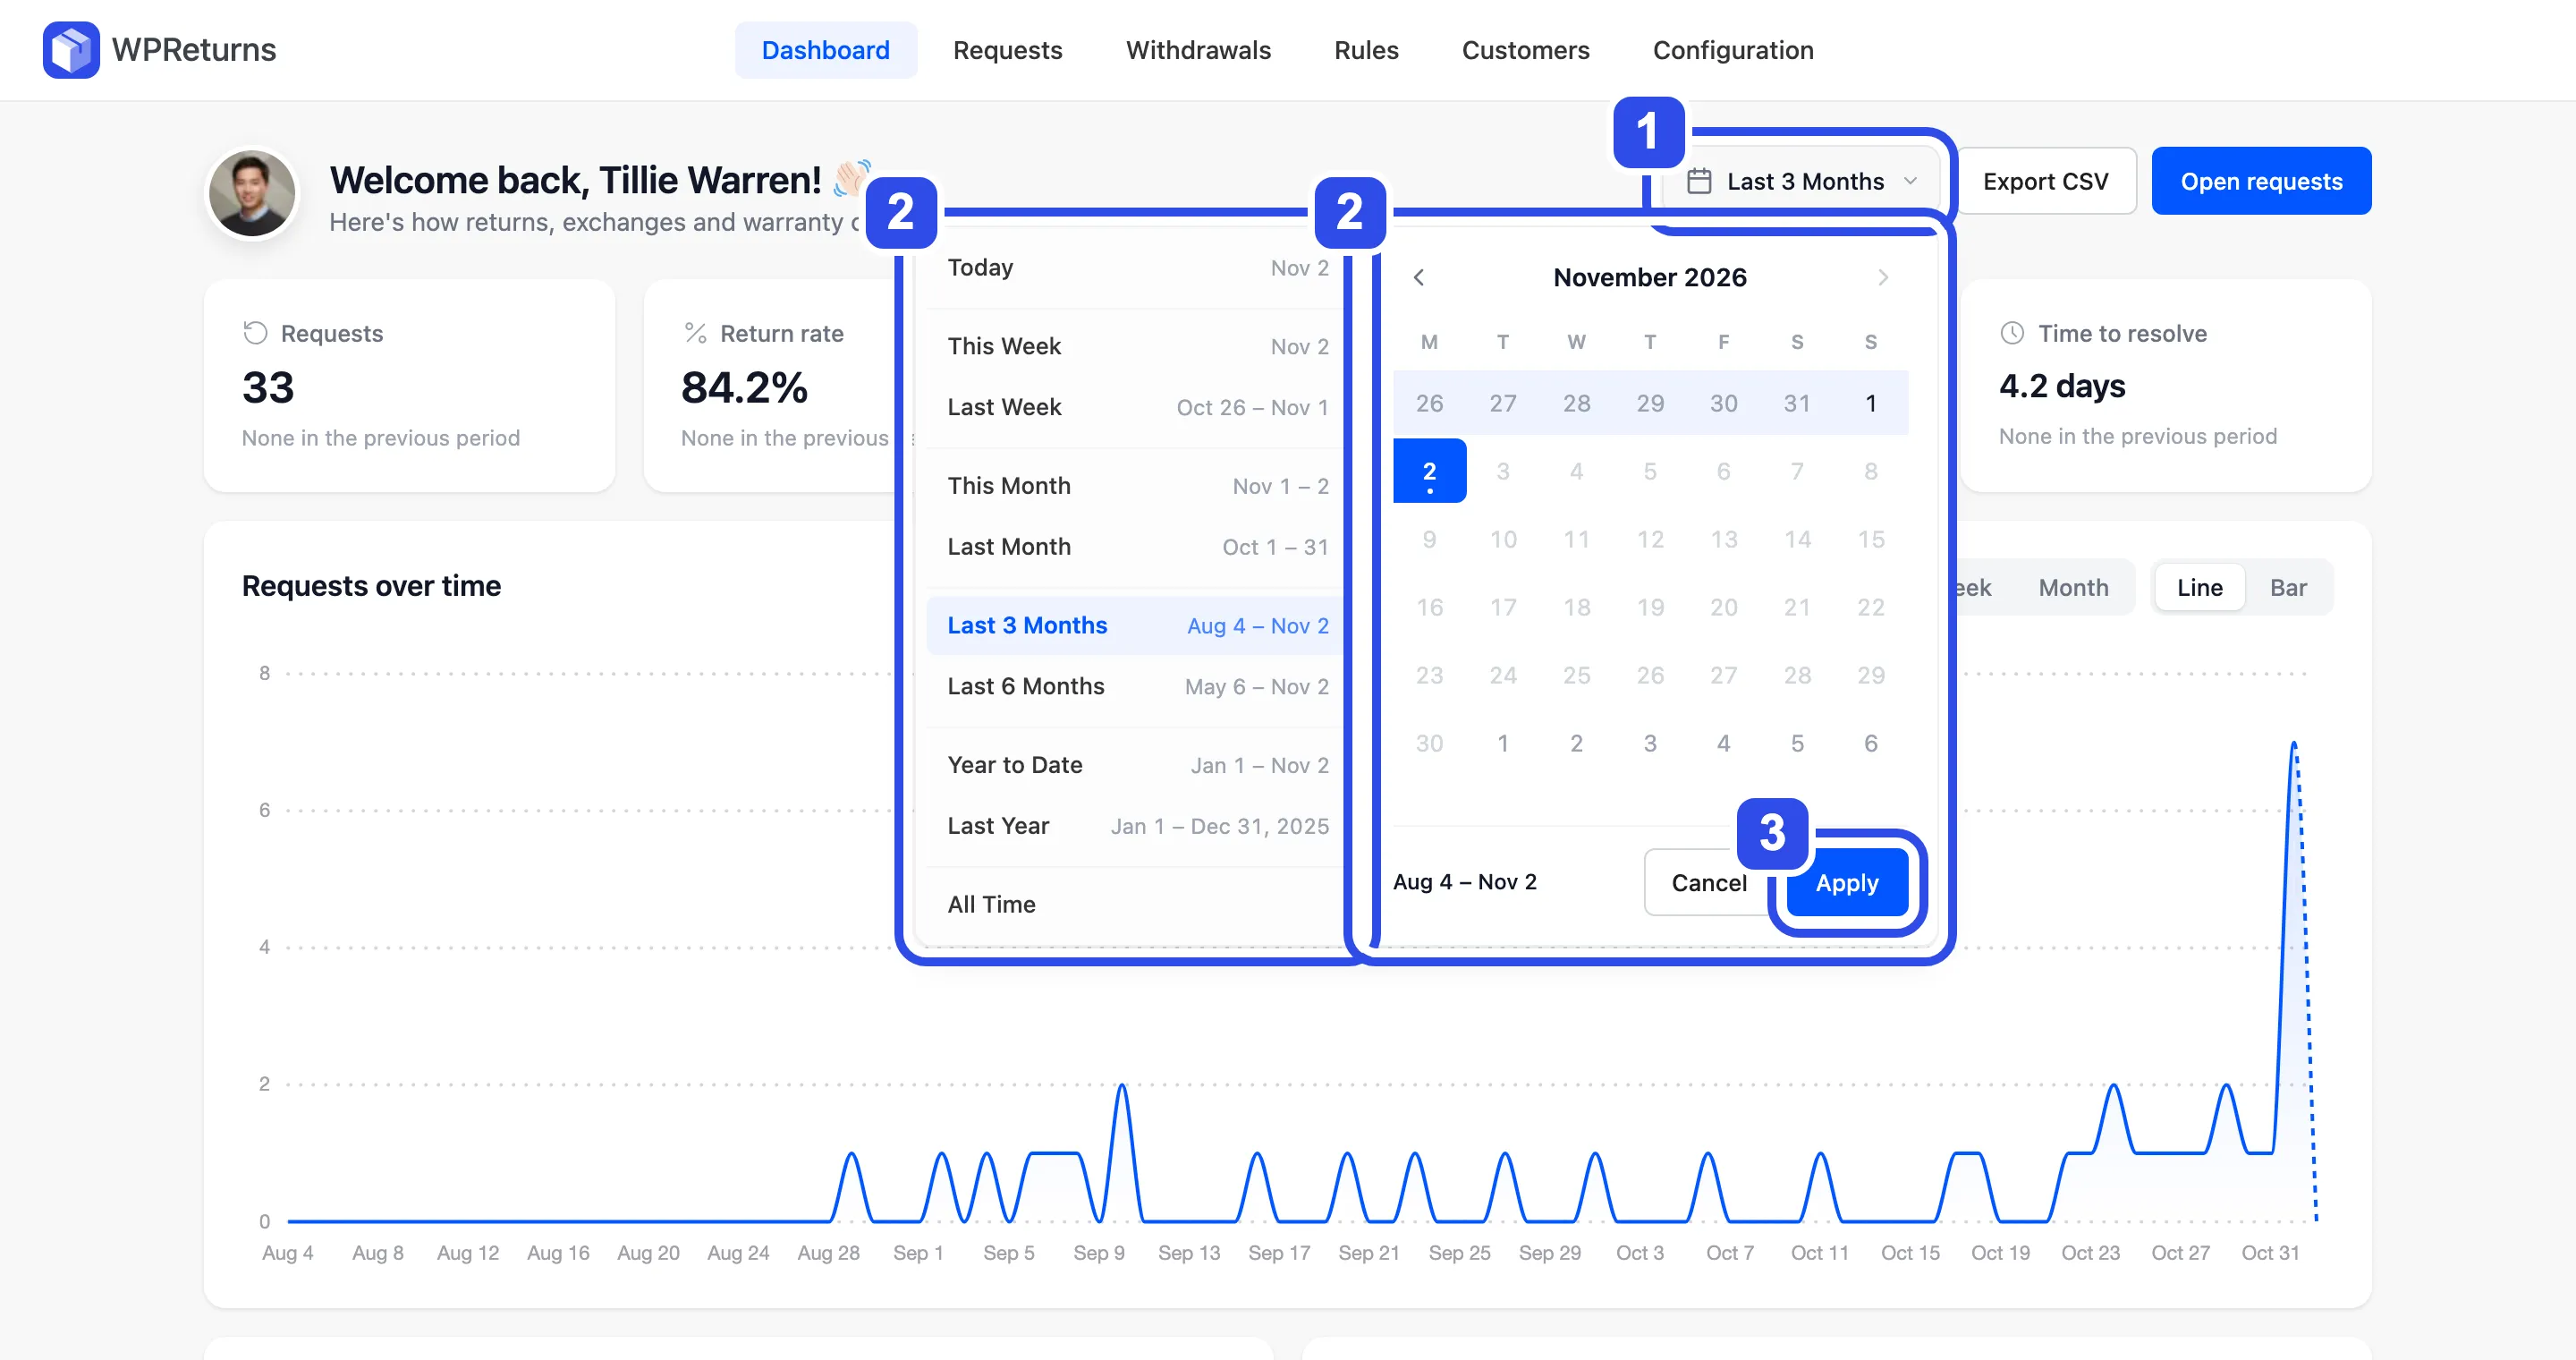
Section titled “Pick a date range”Use the date range control at the top of the dashboard. Every card, chart and list follows the range.
- Open the date range control.
- Pick a preset or select a start and end day on the calendar.
- Select Apply.
Presets run from Today and This Week through Last 3 Months and Last 6 Months to Year to Date, Last Year and All Time.
Export the data to CSV
Section titled “Export the data to CSV”- Pick the date range.
- Select Export CSV in the dashboard header.
The file holds every request created in that range, with one row per item. It has the same columns as the export on the Requests list. See Requests list.
Open requests next to it opens the Requests list on the Open tab.
Read the numbers
Section titled “Read the numbers”A few patterns are worth checking each month:
- A high return rate on one category often points to sizing or description problems. Open Returns by category and Top reasons together.
- Revenue kept rising while Refunded falls means store credit and exchanges are working. A credit bonus can push this further. See Resolution settings.
- A rising Time to resolve usually means requests wait for review. Auto-approve rules and automatic resolution help. See Return rules and Automation.